Published prediction
Meeus → Sinnott’s December 1982 article → the factual times in this concordance.
Follow three 1982 eclipses through published predictions, recorded shadow crossings and atmospheric measurements. See what each source contributes—and which questions the comparison can answer.
Jean Meeus supplied the advance crater predictions printed by Roger W. Sinnott. David Herald and Sinnott later analysed observations preserved by Byron Soulsby, Joseph Ashbrook and a large observer network. Their work makes this learning route possible.
Babylon adds a passage between the sources: a reproducible prediction-to-record concordance, an interval view of rounded times, an explicit source-lineage map and a route to independent atmospheric evidence. The new comparison is descriptive; it does not replace their multi-eclipse analysis or refit a physical ephemeris.
Thirty factual times were checked in the printed December 1982 article. Aggregates below are calculated from the public VI/140 compilation. This page publishes our calculations and source references; private correspondence and article scans remain outside the public library.
The final paragraphs of Sinnott’s December 1982 article, printed p.619, give approximate Universal Times for 15 craters entering and leaving the umbra. The article’s main analysis concerns the July 5–6 eclipse; the December prediction list is a separate part of that publication.
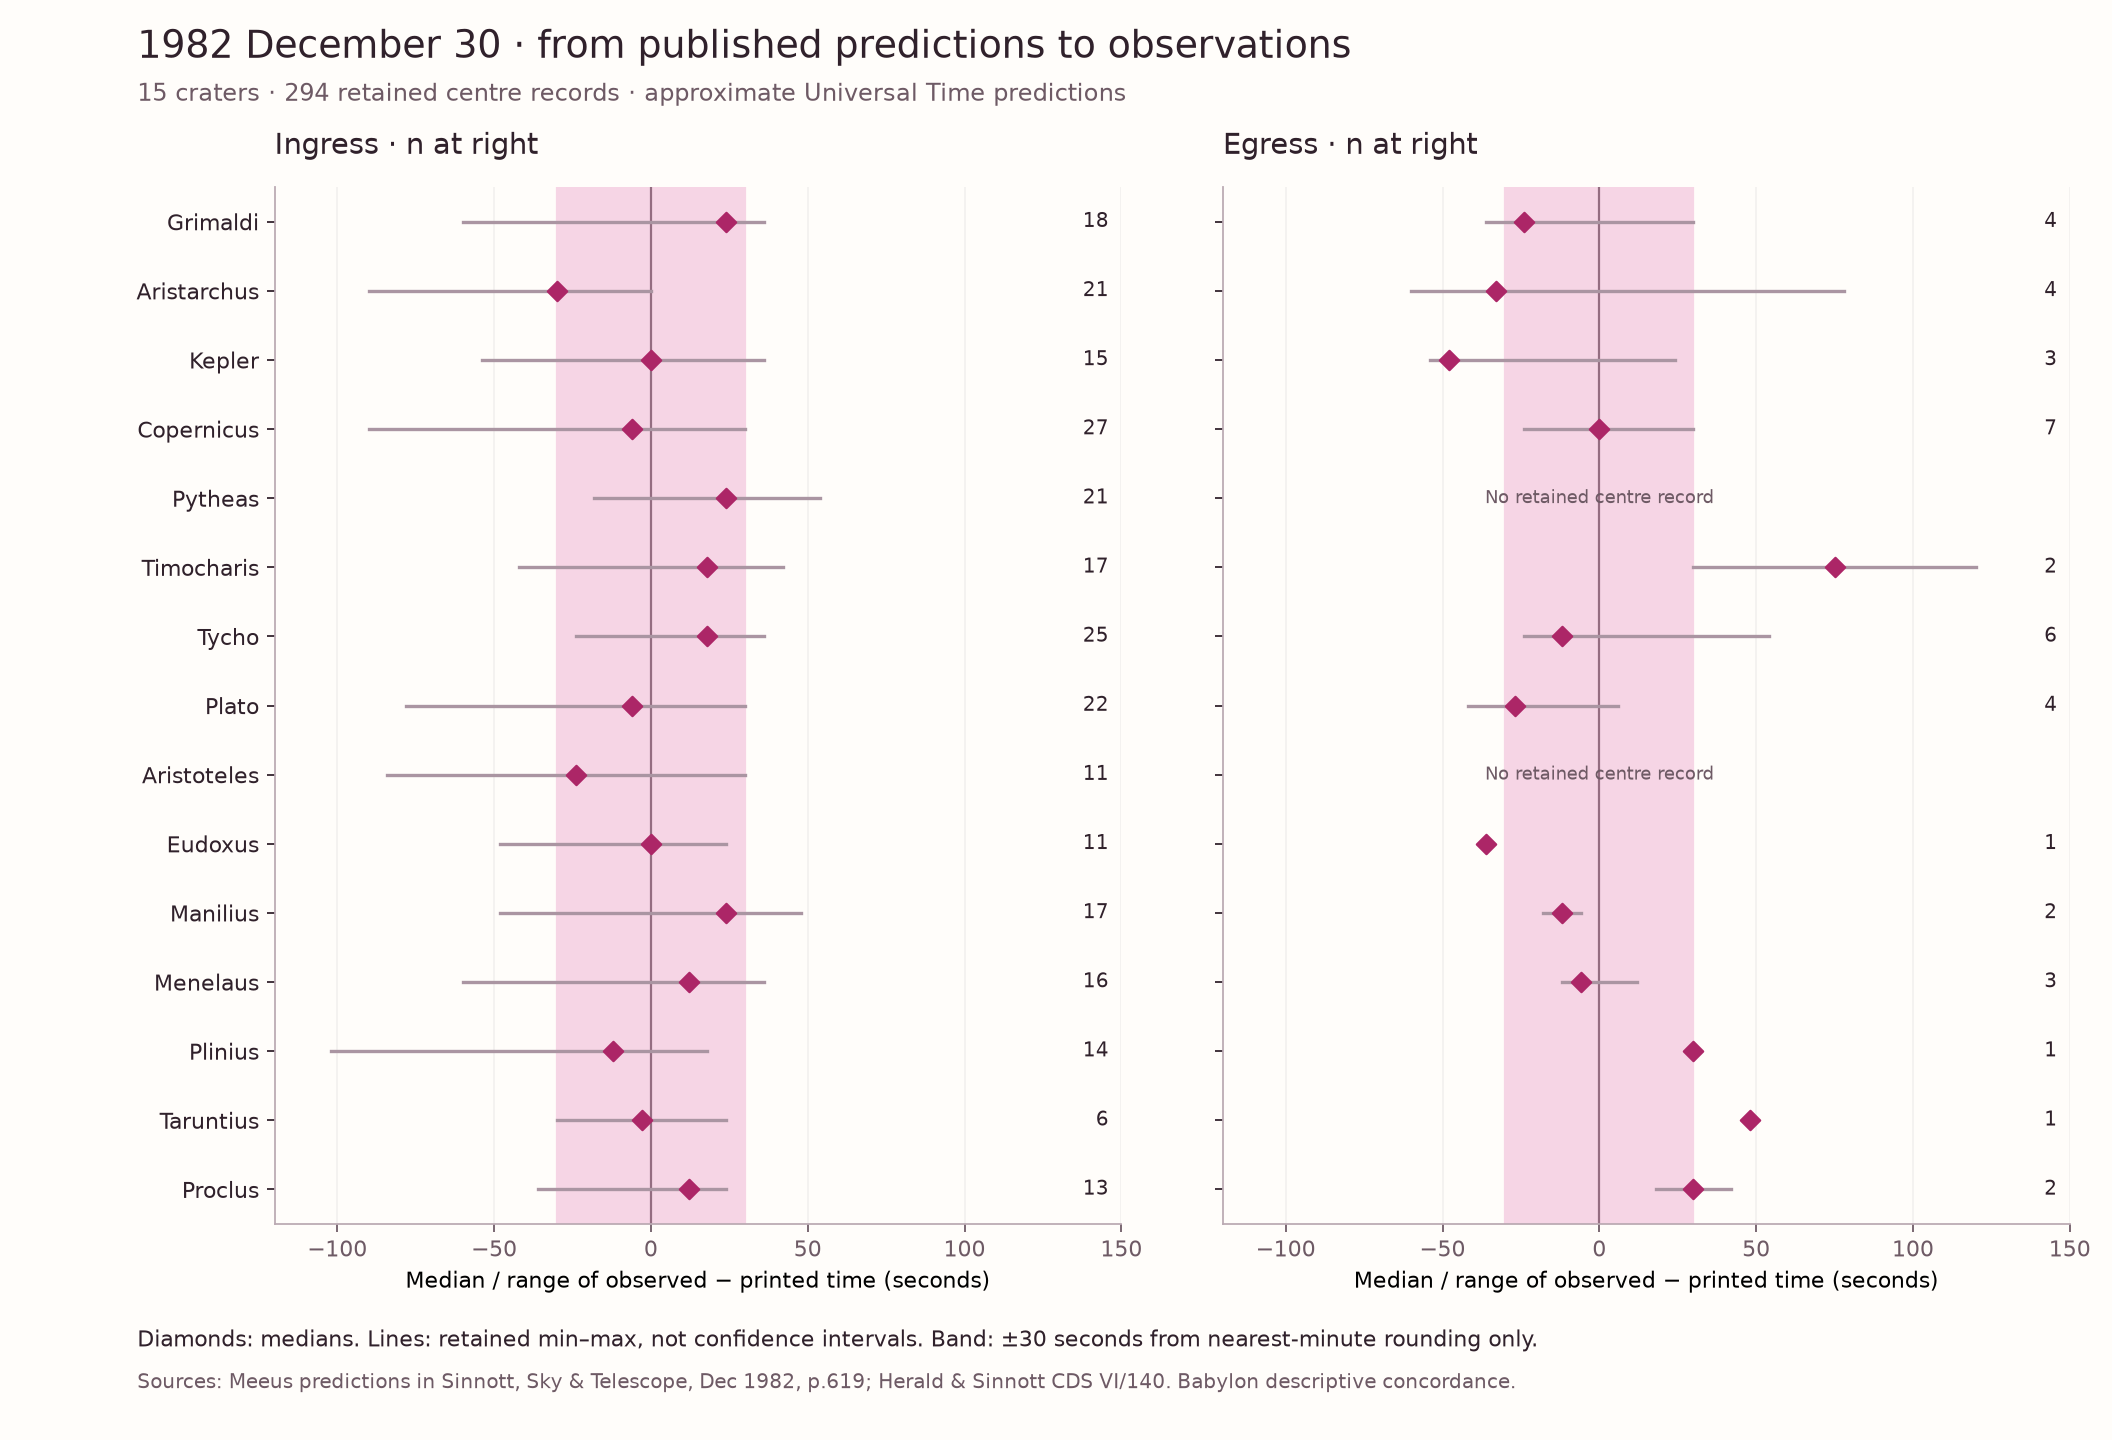
Of 30 predicted feature/direction pairs, 28 have retained centre records. These account for 294 of December’s 347 centre timings; the other 53 concern features outside this prediction list. All 144 feature-edge records and 44 limb contacts remain outside this comparison. No additional outlier rejection was applied.
The 28 group medians range from 48 seconds before to 75 seconds after the printed time; 23 fall within 30 seconds of it. That count is not a goodness-of-fit probability. Small groups, repeated observers, selection and a shared compilation prevent treating these summaries as independent confirmations.
30 prediction pairs
| Crater | Crossing | Printed UT | Records | Observed median UT | Median minus printed time | Observed residual range |
|---|---|---|---|---|---|---|
| Grimaldi | Ingress · entering | 09:53 | 18 | 09:53:24 | +24 s | -60 s to +36 s |
| Grimaldi | Egress · leaving | 12:14 | 4 | 12:13:36 | -24 s | -36 s to +30 s |
| Aristarchus | Ingress · entering | 10:08 | 21 | 10:07:30 | -30 s | -90 s to +0 s |
| Aristarchus | Egress · leaving | 12:10 | 4 | 12:09:27 | -33 s | -60 s to +78 s |
| Kepler | Ingress · entering | 10:05 | 15 | 10:05:00 | +0 s | -54 s to +36 s |
| Kepler | Egress · leaving | 12:18 | 3 | 12:17:12 | -48 s | -54 s to +24 s |
| Copernicus | Ingress · entering | 10:14 | 27 | 10:13:54 | -6 s | -90 s to +30 s |
| Copernicus | Egress · leaving | 12:24 | 7 | 12:24:00 | +0 s | -24 s to +30 s |
| Pytheas | Ingress · entering | 10:17 | 21 | 10:17:24 | +24 s | -18 s to +54 s |
| Pytheas | Egress · leaving | 12:20 | 0 | No retained centre record | — | — |
| Timocharis | Ingress · entering | 10:23 | 17 | 10:23:18 | +18 s | -42 s to +42 s |
| Timocharis | Egress · leaving | 12:20 | 2 | 12:21:15 | +75 s | +30 s to +120 s |
| Tycho | Ingress · entering | 10:12 | 25 | 10:12:18 | +18 s | -24 s to +36 s |
| Tycho | Egress · leaving | 12:43 | 6 | 12:42:48 | -12 s | -24 s to +54 s |
| Plato | Ingress · entering | 10:35 | 22 | 10:34:54 | -6 s | -78 s to +30 s |
| Plato | Egress · leaving | 12:12 | 4 | 12:11:33 | -27 s | -42 s to +6 s |
| Aristoteles | Ingress · entering | 10:44 | 11 | 10:43:36 | -24 s | -84 s to +30 s |
| Aristoteles | Egress · leaving | 12:19 | 0 | No retained centre record | — | — |
| Eudoxus | Ingress · entering | 10:42 | 11 | 10:42:00 | +0 s | -48 s to +24 s |
| Eudoxus | Egress · leaving | 12:22 | 1 | 12:21:24 | -36 s | -36 s to -36 s |
| Manilius | Ingress · entering | 10:30 | 17 | 10:30:24 | +24 s | -48 s to +48 s |
| Manilius | Egress · leaving | 12:35 | 2 | 12:34:48 | -12 s | -18 s to -6 s |
| Menelaus | Ingress · entering | 10:34 | 16 | 10:34:12 | +12 s | -60 s to +36 s |
| Menelaus | Egress · leaving | 12:37 | 3 | 12:36:54 | -6 s | -12 s to +12 s |
| Plinius | Ingress · entering | 10:38 | 14 | 10:37:48 | -12 s | -102 s to +18 s |
| Plinius | Egress · leaving | 12:40 | 1 | 12:40:30 | +30 s | +30 s to +30 s |
| Taruntius | Ingress · entering | 10:45 | 6 | 10:44:57 | -3 s | -30 s to +24 s |
| Taruntius | Egress · leaving | 12:52 | 1 | 12:52:48 | +48 s | +48 s to +48 s |
| Proclus | Ingress · entering | 10:48 | 13 | 10:48:12 | +12 s | -36 s to +24 s |
| Proclus | Egress · leaving | 12:47 | 2 | 12:47:30 | +30 s | +18 s to +42 s |
The comparison uses catalogue event 2 for feature centres at ingress and event 7 at egress. A zero-record cell means no matching retained centre event in this selection; it does not establish that no one observed the crossing.
A time printed to a whole minute should not be silently treated as exact to one second. This tool applies a nearest-minute interval model of ±30 seconds. It shows how publication precision changes the comparison without inventing an unrounded prediction.
Printed prediction: 10:14 UT. Nearest-minute interval: 10:13:30 to 10:14:30.
Observed median: 10:13:54 UT from 27 retained centre records. Relative to a possible unrounded prediction, the median difference spans −36 to +24 seconds.
This interval accounts for publication rounding only. It does not include observer scatter, clock error, crater identification, geometric-model uncertainty or data selection. The historical list’s exact enlargement convention and unrounded output remain unverified here.
Let P be the printed time and O the observed median. Under the nearest-minute assumption, the unrounded prediction lies between P − 30 and P + 30 seconds. The possible median difference is therefore (O − P) − 30 through (O − P) + 30 seconds. Endpoint details do not affect the one-second display. The tool does not produce a physical significance test.
The catalogue assigns dates by Universal Time at mid-eclipse. The July event is described as July 5–6 in the contemporary article. These retained counts are not the original worldwide submission totals.
| Date, UT | All rows | Limb contacts | Centres | Feature edges |
|---|---|---|---|---|
| 1982-01-09 | 469 | 25 | 44 | 400 |
| 1982-07-06 | 1164 | 84 | 674 | 406 |
| 1982-12-30 | 535 | 44 | 347 | 144 |
Rows encode different event types. A feature centre, a feature rim and the Moon’s limb need different definitions. Stellar occultations—stars disappearing behind or reappearing from the Moon—are another observable, and are kept outside this shadow-crossing dataset.
A public catalogue, its mirror and a paper analysing it can all carry the same observations. Our map records what each source adds before counting it as independent support for a particular claim.
Meeus → Sinnott’s December 1982 article → the factual times in this concordance.
Observer reports → historical collections → corrected VI/140 records → the 2014 analysis. Repeated publication does not create new observations.
NASA’s explanatory page documents different conventions and quotes earlier S&T results. Those quoted values share the original observation lineage.
NASA-RP-1136 supplies independent atmospheric profiles from October–November 1982. It measures another quantity, at other times and places.
These are complementary roles. They become independent witnesses only to a clearly stated proposition that their measurements can actually test.
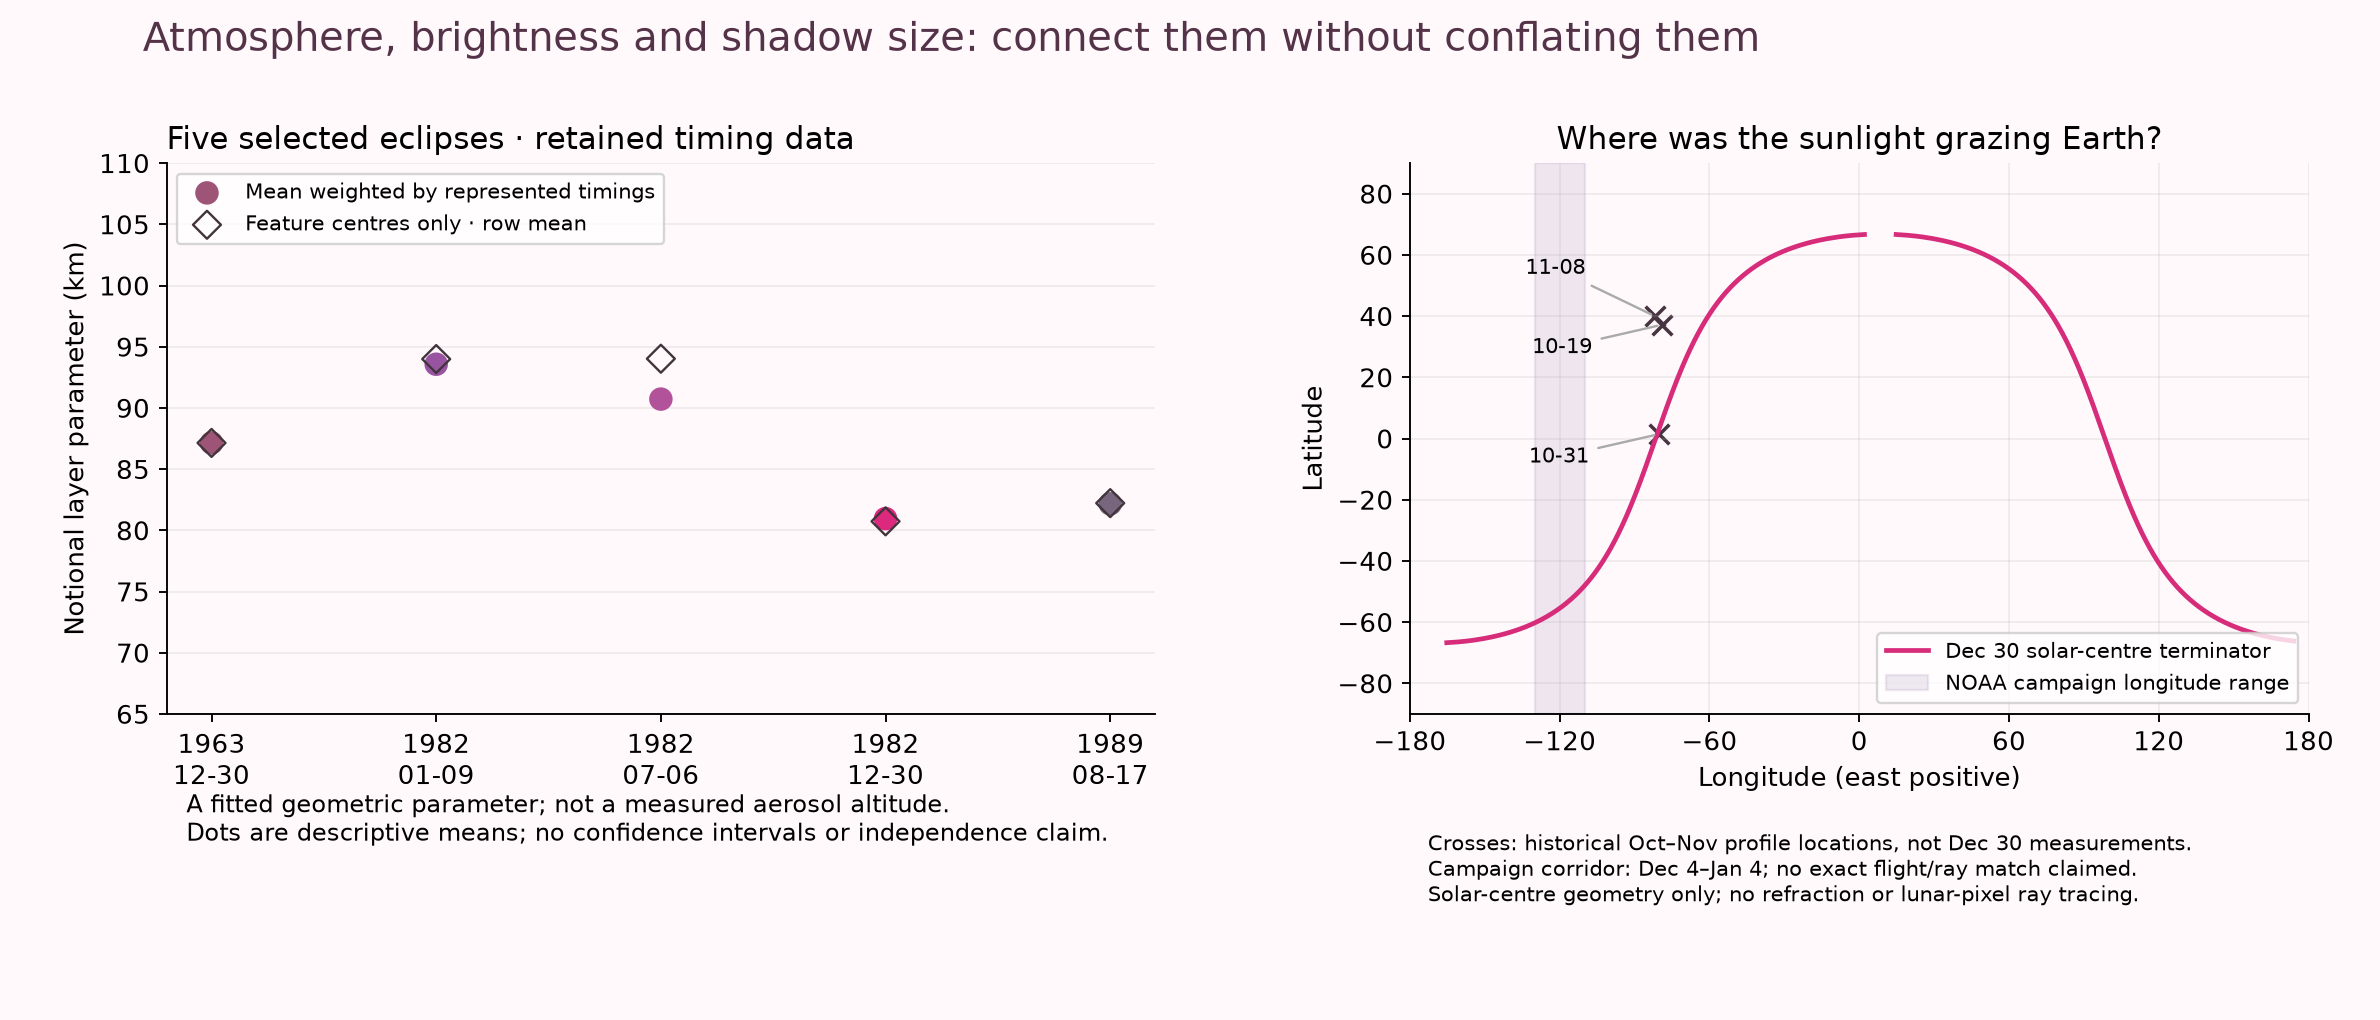
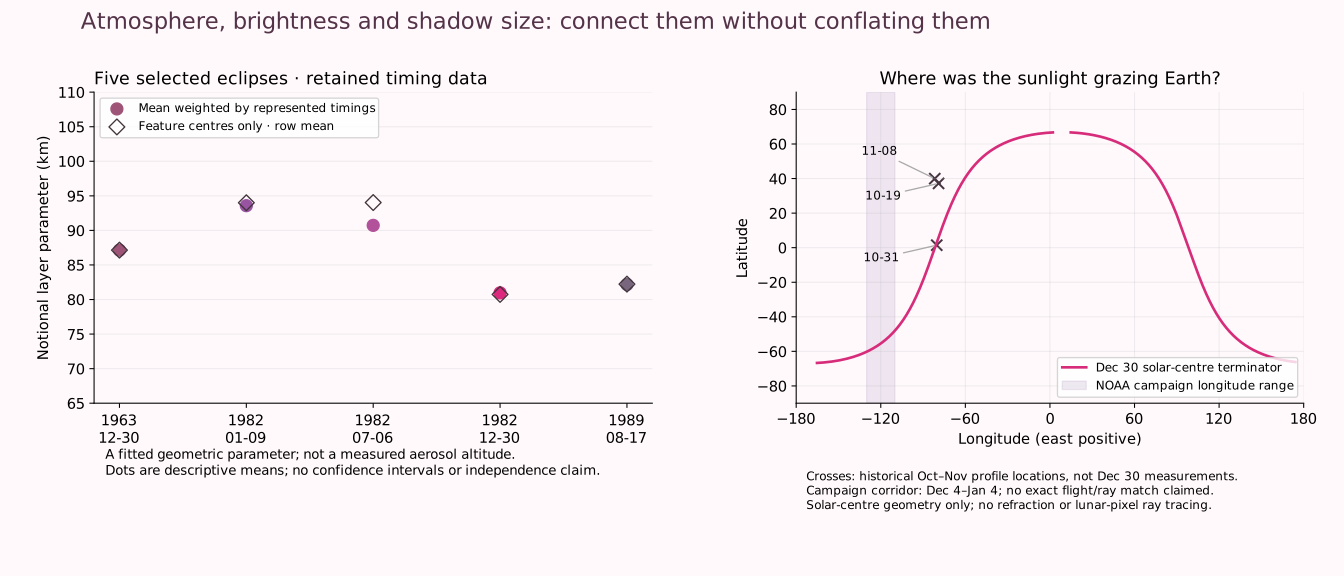
Our first follow-through connects dated atmospheric records to eclipse geometry and compares five selected eclipses. It identifies closer observations and tests a simple proposed relationship. It does not yet pair an individual atmospheric profile with the refracted rays illuminating a particular lunar crater.
| Record | Date and coverage | What it can tell us | Still needed |
|---|---|---|---|
| NASA-RP-1136 lidar | GMT log: October 19–November 8, 1982. Campaign approximately 46°N–46°S. | Profiles from 52–72 calendar days before December 30; historical distribution, not same-day atmosphere. | Time evolution and a ray-path match. Numerical OCR bins require checking before integration. |
| NOAA GMCC Figure 79 | December 4, 1982–January 4, 1983; 110–130°W longitude. | Campaign interval overlaps the eclipse. Figure gives 500-nm optical-depth variation by latitude. | Individual flight dates, UTC, coordinates, optical-depth values, errors and flags. A campaign overlap is not an exact observation match. |
| Wyoming balloon record | Smithsonian reports data collected December 30 at Wyoming, 41°N. | A same-calendar-day independent profile lead, describing aerosol between roughly 10 and 30 km. | Original launch time, longitude, altitude bins and calibration. This bulletin alone does not establish the eclipse ray path. |
| July versus December appearance | Smithsonian December 1982 report. | Different qualitative darkening patterns were reported for the two eclipses. | Calibrated spatial photometry and observing metadata before estimating an aerosol–brightness relationship. |
A detail recovered from the full NASA report: the introduction says October 19–November 7, but Table A1 and the final profile explicitly continue into November 8 GMT. We use the dated tables. The report also states that scattering ratios can be underestimated by up to 10%; that systematic effect is outside the plotted one-sigma error bars. These lidar ratios measure backscatter at 0.6943 µm, not a direct, interchangeable extinction profile at every wavelength.
The approximate solar-centre terminator is the circle where the Sun’s centre is on the horizon. At December greatest eclipse its northern and southern latitude limits are about 66.8°. This circle is a first geographic screen. Actual refracted sunlight has a range of tangent heights and paths, with contributions determined by the Sun’s finite disk, clouds, ozone, aerosols and the point on the Moon being measured.
| Date | Greatest UT1 | Sun declination | Approximate subsolar longitude | Terminator latitude limits |
|---|---|---|---|---|
| 1982-01-09 | 19:55:51.2 | -22.06° | -117.16° | ±67.94° |
| 1982-07-06 | 07:30:54.5 | +22.71° | +68.42° | ±67.29° |
| 1982-12-30 | 11:28:44.3 | -23.17° | +8.42° | ±66.83° |
Longitudes are east-positive. Solar coordinates and greatest times: Eclipse Predictions by Fred Espenak, www.EclipseWise.com. These are retrospective DE405/Danjon calculations, kept separate from the original 1982 advance predictions. The screen combines solar coordinates with Greenwich mean sidereal time and omits nutation, Earth’s oblateness, finite solar disk and atmospheric refraction; displayed decimals do not represent a validated path-location uncertainty.
Three representative NASA profile headers were checked: October 19 near 37°N, 79°W; October 31 near 1.5°N, 80°W; and November 8 near 40°N, 82°W. The October 31 location falls roughly 0.6° from the December solar-centre terminator in this screen—but its profile is 60 days old. Nearness on a map does not establish the atmosphere’s later state. At 41°N the terminator crosses about 60°W and 77°E at greatest in this approximation; the Wyoming report needs precise launch coordinates and time before any path association.
The question screened here is whether unusual darkness necessarily goes with a larger inferred shadow. We selected the three 1982 eclipses, the very dark volcanic comparison of December 1963, and the well-observed August 1989 contrast discussed by Herald and Sinnott. This is a retrospective comparison of chosen examples, not a random sample, holdout validation or new causal model.
| Date | Retained rows | Represented timings | Weighted mean NEL | Centre-only mean | Centre ingress / egress means |
|---|---|---|---|---|---|
| 1963-12-30 | 615 | 615 | 87.15 | 87.15 (615 rows) | 86.85 / 88.44 |
| 1982-01-09 | 469 | 469 | 93.58 | 94.00 (44 rows) | 113.35 / 81.81 |
| 1982-07-06 | 1164 | 1164 | 90.73 | 94.03 (674 rows) | 92.15 / 100.53 |
| 1982-12-30 | 535 | 535 | 80.96 | 80.74 (347 rows) | 80.94 / 79.67 |
| 1989-08-17 | 1080 | 1119 | 82.17 | 82.23 (690 rows) | 84.30 / 79.02 |
Result: the exceptionally dark December 1982 eclipse has a smaller inferred NEL mean than July and January 1982. December remains lower than both for feature centres alone and under an equal-reporting-label sensitivity check. The examples challenge a simple “darker means larger” rule; they do not show that aerosols have no effect on brightness or estimate what caused the timing differences.
We weight all-event means by the number of timings represented in each row; subgroup means use retained rows equally. Thus August 1989 has 1,080 rows representing 1,119 timings, and its weighted mean reproduces the paper’s approximately 82.2 km. Centres, rims and limb contacts have different distributions. January has only 44 centre records and six reporting-label groups. A reporting label is not proof of an independent observer; weighting labels equally is a sensitivity check, not an independence correction. The downloadable record preserves subgroup results.
All five events retain the catalogue’s existing −50 to +250 km NEL selection. No new outlier cuts, regression, significance test or total uncertainty interval were added. Repeated reporters, uneven lunar features, different geometries and selection limits remain. The original authors’ 94-eclipse study found no statistically significant brightness–shadow-size correlation; our comparison uses their retained observations and is not independent replication.
The approximately 87 km NEL is a model parameter inferred from timings. NASA’s 23–25 km aerosol maximum is an atmospheric measurement. These heights describe different quantities; subtracting them does not expose a missing physical layer.
That is the missing bridge: atmospheric conditions on the relevant rays, measured independently, connected to an explicitly defined eclipse observation. The present work supplies a dated source map, geometry screen and reproducible descriptive comparison.
Printed pp.1–2, Table A1 p.30; Tables A2–A43 pp.31–114. Full report examined for campaign dates, sampled profile headers, method and errors; not all OCR numeric bins validated.
Printed pp.99–100, Figure 79. Figure 79 visually verified: campaign 2, 4 December 1982–4 January 1983, 110–130°W. Aggregate curve; individual flight times and points not recovered.
Balloon, aircraft and eclipse paragraphs. Reports Wyoming balloon data dated 30 December; no exact launch time or full numerical profile supplied. Describes July and December eclipse darkening; qualitative, not calibrated photometry.
Abstract, DOI 10.1126/science.222.4627.1011. 21-eclipse brightness study located; abstract reviewed. Eclipse-derived aerosol estimates are not independent atmospheric witnesses to the same eclipse brightness.
Dutton & DeLuisi 1983a; NOAA Data Report ERL ARL-12 (1987). Identifies the precise paper and data report to request for original dated optical-depth observations.
Equations 16–19, p.7. GMST-to-longitude relation used for approximate footprint screening, not atmospheric ray tracing.
crater_t.dat; doc.txt. Five selected eclipse dates; public catalogue has 22,539 retained rows for 94 events. Weighted means account for represented timings; subgroup means are unweighted rows.
Printed pp.250–253. Prior 94-eclipse analysis; same timing lineage as catalogue, not independent replication. No statistically significant darkness–shadow-size correlation reported.
Geocentric coordinates; greatest UT1. Retrospective DE405/Danjon predictions. Eclipse Predictions by Fred Espenak, www.EclipseWise.com
Geocentric coordinates; greatest UT1. Retrospective DE405/Danjon predictions. Eclipse Predictions by Fred Espenak, www.EclipseWise.com
Geocentric coordinates; greatest UT1. Retrospective DE405/Danjon predictions. Eclipse Predictions by Fred Espenak, www.EclipseWise.com
Herald and Sinnott report that experienced observers’ individual crater timings still scatter by roughly 25–30 seconds, and that primary limb contacts are harder to judge. Their multi-eclipse analysis finds the shadow shape consistent with Earth’s known oblateness; this single-event concordance does not independently prove that result.
A gradual brightness boundary, an observer’s judgement and an atmospheric model all enter the measurement. A timing residual alone does not establish a physical firmament. Nor does the word “sphere” make a mathematical coordinate surface into a material wall.
For the scriptural comparison, Genesis and Enoch retain their own passages, settings and timekeeping language. Babylon’s authored reflection can explore those meanings while the physical claim is tested through measurements.
Our public research questions remain open: the original December 1982 p.574 limb table, April 1983 p.387 post-event report, detailed observing metadata and an item-level correction or exclusion trail. Their absence from this study does not establish deliberate concealment.
Reviewed 11 November 2026. Predictions, retained records, physical-model interpretation and Babylon’s new calculations are identified separately.
Printed p.619: 15 pairs of approximate Universal Times credited to Jean Meeus for December 30. Factual times transcribed from an inspected reading copy. The article analyses the July eclipse; its final paragraphs supply the December predictions. Link provides the catalogue bibliography, not a copy of the scan.
Contemporary publication; predicted times are not measurements.22,539 retained records for 94 eclipse dates; 535 rows for 1982 December 30. Event codes distinguish limb contacts, centres and edges.
One compiled dataset; its mirrors and the 2014 paper are not independent replications.Documents a model-derived layer-height inclusion range of −50 to +250 km and heterogeneous timing precision. The precise number and identity of discarded original reports cannot be recovered from retained rows alone.
Documentation of the same compilation.Model derivation and multi-eclipse interpretation. A notional layer is a timing-derived model parameter, not a detected opaque shell; single-observer scatter and bias matter.
Analyses the same retained catalogue; not an independent observational witness.Historical enlargement conventions, a gradual shadow boundary, and earlier S&T summary results. Its July and December 1982 table entries derive from S&T, so those values are not independent confirmations.
Partly shares the published observation lineage.Full report reviewed for method, errors, GMT flight log and three sampled profile headers. Table A1 extends through November 8 GMT; December eclipse matching remains incomplete. The main plume aerosol maximum is 23–25 km, a different quantity from the timing-derived notional layer.
Different instrument, quantity, dates and spatial coverage; a physical-context lead, not a direct December 30 replication.No private correspondence, email addresses, supplied scans or complete source catalogue is redistributed here. The source map and downloads contain bounded aggregate calculations and bibliographic references.
In Babylon, the Father’s light opens perspective, learning and a chosen next step. Your worth remains intact. Every person is sovereign, with dignity, freedom and room to grow.
Read the learning principle ↗Open the layers, inspect a real balloon profile and follow earthquake arrivals from measurements to interpretation.
Explore Earth above and below ↗Compare the atmosphere, engine burns, outside radio observations and return engineering, with calculations, documented findings and an eight-track investigation map.
Follow Apollo 11 from launch to return ↗