Compare Apollo 11 with the April 2026 Artemis II lunar flyby. Follow outside radio recordings into a limited numerical test, inspect the public trajectory and help close specific record gaps.
Research snapshot · 15 November 2026 · Babylon calculations, not a NASA assessment
WHAT TODAY’S TEST ACTUALLY SHOWS
The frequency trend is reproducible. Calibration is the next task.
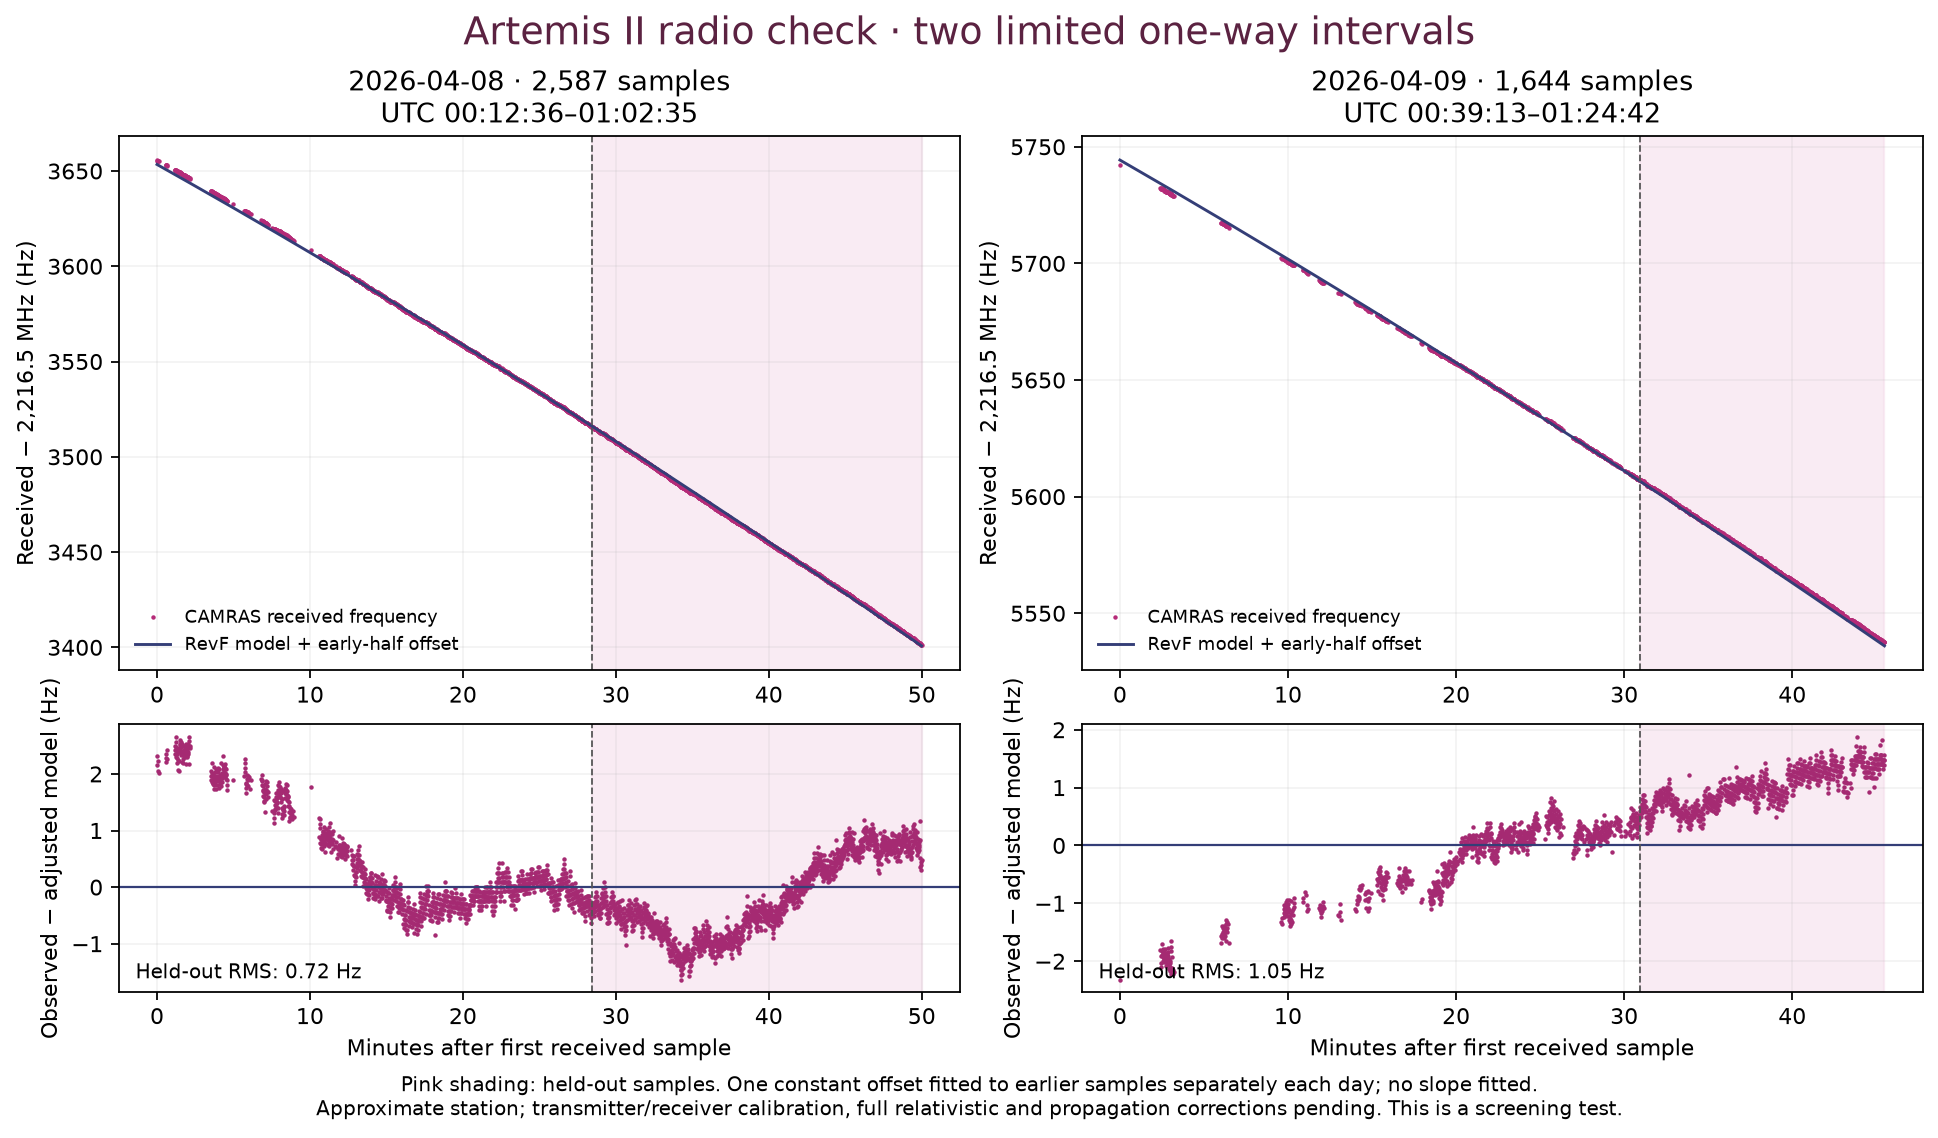
The observed radio-frequency changes broadly follow our geometry calculation after one constant offset is fitted separately for each night. Later, held-out samples have an RMS difference of 0.72 Hz on April 8 and 1.05 Hz on April 9. The offsets and remaining time structure need explanation before this becomes a calibrated navigation test.
These short intervals do not validate the full journey, establish an independent orbit, test a material firmament or demonstrate a flight anomaly. They give us a concrete calculation and questions that the data authors can answer.
WHAT BABYLON IS DOCUMENTING
From a Moon journey to a checkable record.
01
The question begins with a journey.
Babylon began by asking how a spacecraft could leave Earth’s atmosphere, travel toward the Moon and return through the atmosphere. To make that question answerable, we follow a chain: a dated mission claim, the instruments that could record it, the measurements they retained, the model used to interpret them and the uncertainty left at the end. A photograph, a reconstructed position and a radio-frequency measurement each contribute a different piece.
02
Apollo gives us a historical record to inspect.
The Apollo 11 report describes an inoperative onboard recorder during entry and limits in the tracking available through the communications blackout. That explains why portions of the entry story require reconstruction. It does not mean that every mission record is missing. We keep the older inquiry focused on named entry inputs, the Best Estimated Trajectory and comparable radiation quantities.
03
Artemis gives us a modern comparison, with a different destination.
Artemis II flew around the Moon in April 2026; Apollo 11 landed there in July 1969. Different paths, spacecraft and entry plans should produce different records. We compare how each claim can be traced rather than expecting identical flight numbers. For Artemis, a public reconstructed trajectory and an outside telescope’s frequency files let us begin a small repeatable test.
04
The receiver provides a test of changing motion.
A radio carrier shifts in frequency as the line-of-sight motion between transmitter and receiver changes. Earth’s rotation moves the telescope too, and the signal arrives after a light-travel delay. We accounted for those geometric effects and selected only the first declared one-way interval on each of two nights. Later intervals name a Deep Space Network transmitter and need a different, two-leg signal model.
05
The result narrows the question.
The two observed frequency curves broadly follow the calculated changes once a separate constant offset is fitted for each night. The remaining differences are small compared with the overall trend, but they contain time structure and cannot yet be assigned to spacecraft motion. Unknown carrier offsets, receiver processing, atmosphere, relativistic frequency transfer and trajectory uncertainty still need to be brought into the same calculation.
06
The next chapter is an answerable request.
Our contribution is a public bridge between records: exact filenames, clocks, units, assumptions, plots and questions. We ask the data authors for the calibration and product references that would let another reader repeat a stronger test. A reply may close a gap, identify a different custodian or show that a particular record was not retained. Each outcome is documented in its own terms; none is pre-labelled concealment.
Compare the evidence, with the missions kept distinct.
Question
Apollo 11 · July 1969
Artemis II · April 2026
What journey?
Lunar landing, surface stay and return.
Crewed lunar flyby and return; no lunar landing.
Which record is central here?
Mission report, entry analysis and our existing eight-track investigation.
Reconstructed RevF geometry plus CAMRAS receiver data.
Where does reconstruction matter?
Entry recorder/tracking limitations documented in §7.5 of the mission report.
Model-based navigation solution using GPS, DSN, JAXA and SSC tracking and modeled forces.
What remains to compare?
Named entry inputs, BET Volume II and matched dosimetry definitions.
Calibrated radio residuals, full entry products and like-for-like radiation data.
NASA/PDS place Artemis II launch on April 1 at 22:35 UTC, the lunar flyby on April 6, and splashdown on April 11 at 00:07 UTC. That splashdown was still April 10 in California. A time-zone change is not a second event.
OUTSIDE RECEIVER DATA + NASA/JPL RECONSTRUCTED GEOMETRY
A small test another reader can follow.
We retained the first PATH=1,2 interval in each April 8–9 TDM file. The file labels these participants Orion and Dwingeloo. These TDM rows are derived frequency estimates, not raw receiver voltages or a continuous mission recording. The later intervals add DSN-56 and are excluded: a coherent ground → spacecraft → receiver link needs uplink frequency ramps, transponder behavior and both light-time legs.
CAMRAS Dwingeloo measurements, CC BY 4.0. Model, interval selection, offsets and figure by Babylon Learning Centre using NASA/JPL SPICE geometry. Open the image to zoom. Gaps in observations are retained; no slope was fitted.
2026-04-08 · 2,587 SAMPLES
00:12:36–01:02:35 UTC
Observed end-to-start change
-254.50 Hz
Calculated end-to-start change
-252.66 Hz
Earlier-half fitted offset
-2,250.70 Hz
Later-half RMS difference
0.72 Hz
Later-half absolute difference · 95th percentile
1.19 Hz
2026-04-09 · 1,644 SAMPLES
00:39:13–01:24:42 UTC
Observed end-to-start change
-204.50 Hz
Calculated end-to-start change
-208.30 Hz
Earlier-half fitted offset
-2,195.52 Hz
Later-half RMS difference
1.05 Hz
Later-half absolute difference · 95th percentile
1.50 Hz
The April 8 and April 9 fitted offsets differ by about 55.19 Hz. We did not force one common calibration across the two nights. RMS summarizes difference size; it is not an uncertainty estimate, a statistical significance or an equivalent spacecraft-position error.
Read the calculation, assumptions and checks
Parse the first TDM metadata block and its received-frequency observations, preserving UTC row timestamps and gaps. Metadata’s integration interval is one second, referenced to the middle.
Load the public RevF and gapfill trajectory, DE430, leap seconds, Earth radii and high-precision Earth orientation. Compute a fixed Earth-site observer in ITRF93, with output in J2000 and converged reception light time using SPKCPO.
Assume a nominal carrier of 2,216,500,000 Hz and use f = f₀ × (1 − range_rate / c). This is a geometric first-order frequency model, not a complete relativistic frequency-transfer solution.
For each date, fit only the median observed-minus-model constant in the earlier half of rows. Evaluate the later half without refitting. No slope, clock drift or trajectory adjustment is fitted. The two dates were selected as an exploratory repeat, not a preregistered mission-level validation.
Use an explicitly approximate site point: 52.812° N, 6.396° E, height 0.025 km on the loaded Earth ellipsoid. The phase centre, datum/height and instrument calibration still need confirmation.
Check range-rate sign and a centered finite-difference calculation: at the sampled April 9 epoch the two rates differ by about 0.008 Hz in frequency-equivalent terms. This numerical cross-check is not an independent observation.
On the tested samples, moving the assumed station by +1 km along individual Earth-fixed Cartesian axes changes the model by at most about 0.38 Hz; shifting timestamps by ±1 second changes it by at most about 0.093 Hz. These are chosen sensitivity probes, not confidence bounds. Deliberately omitting light time changes the model by up to about 0.70 Hz.
Residuals show time structure, so treating all rows as independent random errors would be inappropriate. Missing corrections include actual transmitter frequency/stability, receiver frequency and clock behavior, estimator conventions, atmospheric propagation, full relativistic transfer and projected trajectory covariance. We have not assigned the residuals to any one cause.
Inspecting the public RevF kernel’s internal comments located 13,186 covariance epoch records, a navigation pedigree and the source OEM filename. This replaces a broad “uncertainty information missing” description with a narrower task: verify units, frame, assumptions and how to propagate that information into a radio-frequency comparison.
The file says it was converted from the June 9 public OEM, cleared for release July 1, with the SPK created July 16. These are production/release-clearance dates, not a verified date when the web download first became available. Its navigation pedigree names GPS, DSN, JAXA and SSC data and modeled forces. That does not establish that an outside receiver’s measurements were held out.
Inspect actual kernel coverage and the five filled intervals
The main trajectory has six disjoint coverage intervals. The companion file fills five short boundaries using interpolated endpoint states; the fill durations are approximately 38.344, 9.001, 11.198, 59.780 and 10.000 seconds. A gapfill interpolation is not an additional observation, and this file is not one continuous multi-day gap.
Product
Start UTC
End UTC
Meaning
RevF interval 1
2026-04-02 01:58:21.397Z
2026-04-02 22:49:21.397Z
Reconstructed trajectory
RevF interval 2
2026-04-02 22:49:59.741Z
2026-04-03 00:02:39.801Z
Reconstructed trajectory
RevF interval 3
2026-04-03 00:02:48.802Z
2026-04-07 00:54:48.802Z
Reconstructed trajectory
RevF interval 4
2026-04-07 00:55:00.000Z
2026-04-10 23:29:00.000Z
Reconstructed trajectory
RevF interval 5
2026-04-10 23:29:59.780Z
2026-04-10 23:33:34.736Z
Reconstructed trajectory
RevF interval 6
2026-04-10 23:33:44.736Z
2026-04-10 23:53:24.643Z
Reconstructed trajectory
Gapfill interval 1
2026-04-02 22:49:21.397Z
2026-04-02 22:49:59.741Z
Endpoint interpolation
Gapfill interval 2
2026-04-03 00:02:39.801Z
2026-04-03 00:02:48.802Z
Endpoint interpolation
Gapfill interval 3
2026-04-07 00:54:48.802Z
2026-04-07 00:55:00.000Z
Endpoint interpolation
Gapfill interval 4
2026-04-10 23:29:00.000Z
2026-04-10 23:29:59.780Z
Endpoint interpolation
Gapfill interval 5
2026-04-10 23:33:34.736Z
2026-04-10 23:33:44.736Z
Endpoint interpolation
These kernels describe separation to entry interface. Launch-to-separation and entry-to-splashdown require other products; their absence from this particular file is a scope limit, not a finding that those flight records never existed.
We could download the NAIF bundle even though the PDS mission page still described SPICE as delayed. That is a discovery/catalogue mismatch in this snapshot. We did not find a record-specific denial of these public files.
A reporting difference, an unlocated product, a calibrated anomaly and a formal access restriction are different findings. Each question below has its own status.
Sent 15 November 2026 · reply pending
Receiver and carrier calibration
The two fitted early-half offsets are about −2,250.70 Hz and −2,195.52 Hz. A carrier/reference offset can mimic an absolute Doppler difference.
Needed next: Phase-centre coordinates, UTC/frequency reference uncertainty, true transmitted carrier/mode, processing flags and the TDM TRANSMIT_FREQ_1 convention.
Route: CAMRAS data authors
Sent 15 November 2026 · reply pending
Trajectory uncertainty and tracking lineage
RevF comments name GPS, DSN, JAXA and SSC tracking, and include 13,186 covariance epoch entries.
Needed next: Covariance units/frame and projection guidance; public OEM and measurement-product references; whether CAMRAS measurements informed the solution.
The inspected RevF kernel starts April 2 at 01:58:21.397 UTC and ends April 10 at 23:53:24.643 UTC. Its notes identify separation-to-entry-interface scope.
Needed next: The named public product covering launch-to-separation and entry-interface-to-splashdown, or the responsible custodian.
Route: Included with navigation-author question
Documented · not separately requested
Reconcile two published summary differences
Two NASA articles give 695,081 and 694,481 total miles. April and October assessments give 2.9 miles from targeted and 0.59 miles from predicted landing site.
Needed next: Definitions, coordinate/time/frame references and revision history. The two landing-reference phrases may name different points.
Route: Mission reporting or navigation referral
Lead located · numerical products pending
Compare the same radiation quantity
A DLR poster abstract describes Artemis II M42 instruments; its numerical dose tables were not obtained in this review. Apollo readouts and assessed dose have their own definitions.
Needed next: Public numerical products, calibration, shielding/position and time intervals, with absorbed/equivalent/effective dose distinguished.
Route: HERA/M42 authors and archive references
Public summary reviewed · product search open
Move from inspection summary to measurement
NASA’s October article reports heat-shield findings and continued laser-scan analysis. A summary is not a complete thermal/ablation dataset.
Needed next: Released sensor timelines, Avcoat maps and recession/model uncertainty products, if publicly available.
Route: Engineering archive or mission data custodian
Public files obtained · stale notice observed
Separate a discovery gap from an access restriction
The PDS landing page still described SPICE as delayed while the NAIF bundle and trajectory files were downloadable.
Needed next: Reconcile the catalogue notice with the data location. For any actual denial, retain the record identifier, stated basis and review route.
Route: PDS/NAIF catalogue maintainers
The total-distance discrepancy is 600 miles, about 0.0863% of 695,081 miles. That arithmetic does not establish the cause. Likewise, “targeted” and “predicted” landing sites may refer to different coordinates or updates. We need definitions before treating these as inconsistent measurements.
Dated correspondence snapshot, not a live inbox. Incoming private messages and headers are not published. No paid work, reproduction order or FOIA filing is authorized by these questions.
CAMRAS / Dwingeloo
Artemis II April 8–9 radio calibration
Which station phase centre, UTC standard and frequency-reference accuracy apply to the April 8–9 TDM files?
Are the first PATH=1,2 intervals free-running one-way carrier; what true transmit frequency and stability information is available?
What does TRANSMIT_FREQ_1 represent in the coherent three-participant segments, and are uplink ramps/lock-state records public?
Which estimator, flags and timing conventions produced the received-frequency rows, and were these data supplied to navigation teams?
NASA JSC navigation / JPL NAIF
Artemis II RevF uncertainty and tracking-product references
What are the covariance frame, units, epoch convention and interpretation, and where is the public OEM or a recommended projection example?
Which released measurement/ramp products support a radio residual calculation; did CAMRAS observations enter RevF directly or indirectly?
Which products cover launch-to-separation and entry-interface-to-splashdown outside this kernel’s declared scope?
Is there a recommended frequency-transfer and clock convention for a ground-receiver comparison with this reconstruction?
Observer work deserves clear credit. Technical assistance does not imply agreement with Babylon’s beliefs or endorsement of our interpretation. Replies will be recorded as dated summaries; a lack of reply will remain a lack of reply.
Open the evidence. Keep the trail.
Public downloads contain Babylon’s bounded findings, calculation assumptions, source hashes and every tenth row used for the plot. Institutional originals remain at their source. Full kernel binaries, research PDFs and private correspondence are not part of this website.
In Babylon, the Father’s light opens perspective, learning and a chosen next step. Your worth remains intact. Every person is sovereign, with dignity, freedom and room to grow.